
Average Commercial Real Estate Rates, Trends, and Market Forecast
In the commercial real estate (CRE) capital markets, tracking interest rate benchmarks is vital for sponsors, syndicators, and institutional investors evaluating debt strategies. As macroeconomic forces shift central bank policy, baseline benchmark rates directly impact property valuations, capitalization rates, and investment returns. Understanding historical trajectory and forward expectations empowers real estate professionals to construct resilient debt structures and optimize pro-forma cash flow modeling.
This comprehensive report examines the average commercial real estate rates across major lending platforms, analyzes 5-year historical trends, presents our cre interest rate forecast for 2026, and provides actionable risk-management strategies for managing interest rate volatility.
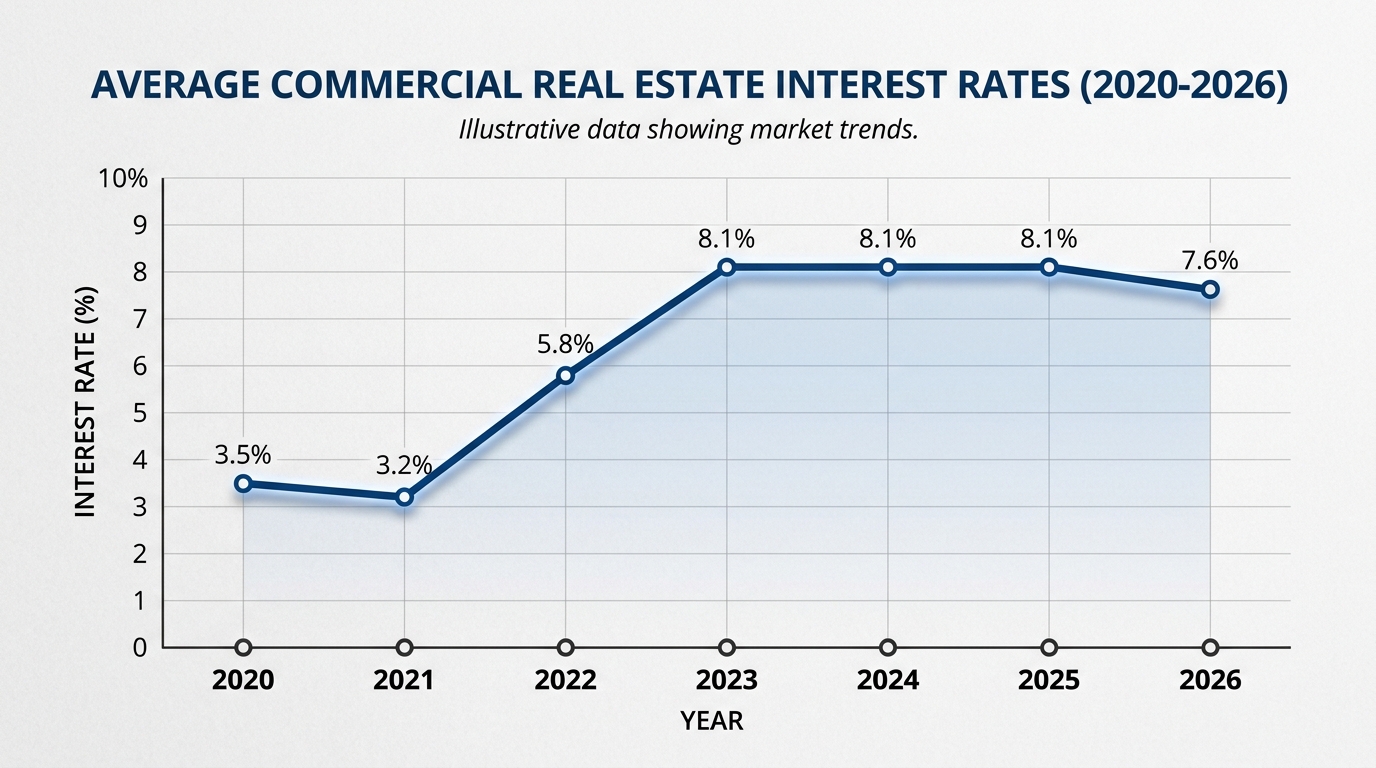
Historical and forecasted average commercial real estate interest rates from 2020 to 2026.
What is the Average Commercial Real Estate Rate?
The average commercial real estate rate currently ranges between 5.85% and 7.35% across stabilized asset classes and conventional financing sources. However, citing a single “average” rate can be misleading, as commercial debt pricing is tailored to property type, loan leverage, location, and sponsor creditworthiness.
Commercial debt pricing consists of a base benchmark rate plus a lender credit risk spread:
$$\text{Commercial Interest Rate} = \text{Benchmark Index (SOFR / 10-Yr Treasury)} + \text{Lender Risk Spread}$$
To establish an accurate operational baseline, investors must review average commercial interest rates across different capital sources:
- Multifamily Agency Debt (Fannie Mae / Freddie Mac): 5.50% – 6.35% (Spread: 140 – 210 bps over 10-Year Treasury)
- Conduit CMBS Financing: 6.25% – 7.15% (Spread: 180 – 260 bps over 10-Year Treasury)
- Commercial Banks & Credit Unions: 6.00% – 7.25% (Spread: 200 – 300 bps over SOFR/Treasury)
- Life Insurance Companies: 5.65% – 6.50% (Low-leveraged, premier asset financing)
- Private Debt Funds / Bridge Debt: 8.75% – 11.50% (Spread: 350 – 600 bps over SOFR)
Investors comparing immediate execution options against historical benchmarks should review current commercial real estate loan rates to benchmark live pricing against long-term averages.
Historical Commercial Loan Rate Trends
Analyzing commercial loan rate trends over a multi-year horizon reveals how rapidly financing environments evolve and how debt costs realign property pricing:
+-----------------------------------------------------------------------------------+
| HISTORICAL COMMERCIAL LOAN RATE TRAJECTORY (2020 - 2026)                          |
+-----------------------------------------------------------------------------------+
|  Period          10-Yr Treasury      SOFR / Libor      Avg Commercial Rate Range  |
|  2020 - 2021     0.60% - 1.50%       0.05% - 0.20%     3.25% - 4.50% (Historic Low)|
|  2022 - 2023     1.60% - 4.80%       0.30% - 5.30%     5.50% - 8.25% (Rapid Shift) |
|  2024 - 2025     3.75% - 4.50%       4.50% - 5.30%     6.25% - 7.75% (Plateau)     |
|  2026 (Current)  3.80% - 4.25%       4.10% - 4.60%     5.85% - 7.35% (Stabilization)|
+-----------------------------------------------------------------------------------+
The Low-Rate Environment (2020–2021)
Following global economic stimulus measures, central bank rates dropped near zero. Benchmark 10-Year Treasuries hovered between 0.60% and 1.50%, enabling borrowers to lock in 10-year fixed commercial mortgages at historical lows between 3.25% and 4.25%. Capitalization rates compressed rapidly as low debt costs drove record acquisition volume.
Monetary Policy Tightening & Rate Escalation (2022–2023)
To counter persistent inflationary pressures, central banks initiated aggressive monetary tightening. Short-term benchmark rates increased by over 500 basis points in under 18 months. Commercial interest rates escalated rapidly from under 4.00% to peak ranges of 7.50% to 8.50%. Floating-rate bridge borrowers experienced significant debt service increases as SOFR rose above 5.30%.
Plateau & Re-Balancing Phase (2024–2025)
As inflation metrics moderated, interest rate hikes ceased, entering a prolonged plateau phase. Benchmark indices stabilized within defined trading ranges, allowing capital markets to absorb elevated borrowing costs. Property pricing adjusted, transaction activity gradually resumed, and cap rates expanded to maintain positive spreads over debt.
Moderate Recalibration (2026 Present)
In 2026, commercial interest rates have settled into a balanced regime. Benchmark index yields have adjusted downward from peak levels, bringing average commercial loan rates into the 5.85% to 7.35% corridor. Lenders have adapted underwriting standards to prioritize sustainable cash flows over speculative asset appreciation.
What is the Interest Rate Forecast for Commercial Real Estate in 2026?
Our cre interest rate forecast for 2026 indicates a environment characterized by moderate rate reductions, stabilized benchmark indices, and competitive credit spreads for top-tier properties. Rather than returning to the historic lows of the previous decade, rates are expected to hover near long-term structural averages.
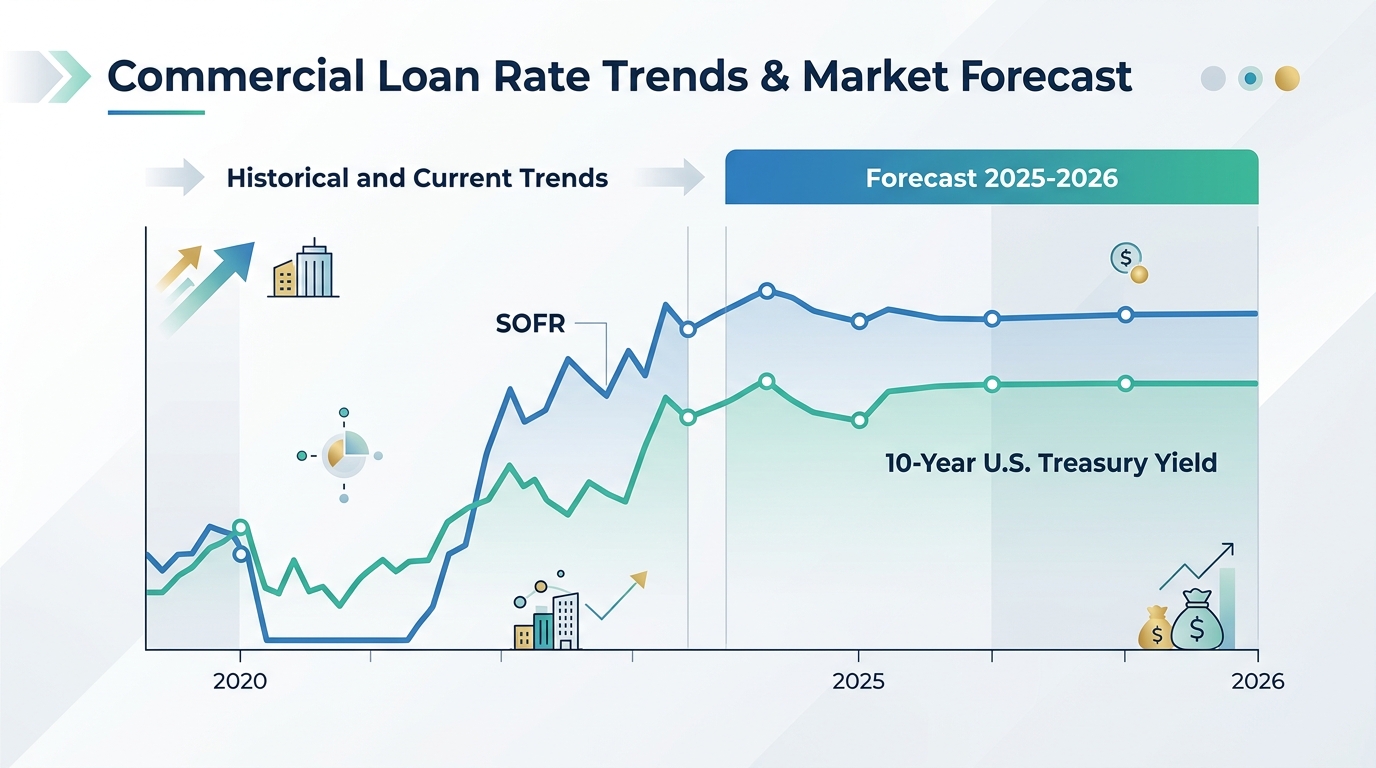
Forecasted commercial loan rate trends and market outlook for 2026.
Federal Reserve and SOFR Outlook
The Secured Overnight Financing Rate (SOFR)—the primary floating-rate benchmark for commercial loans, line-of-credit facilities, and debt fund capital—is heavily influenced by central bank monetary policy. (Secured Overnight Financing Rate (SOFR))
- Target Rate Trajectory: As core inflation aligns near central bank targets, policy rate adjustments are expected to maintain SOFR within a range of 3.75% to 4.25% through late 2026.
- Impact on Variable Debt: Decreases in SOFR provide tangible debt service relief for floating-rate borrowers. However, lenders maintain SOFR floors (typically set between 3.00% and 3.50%) in loan documentation to preserve minimum profit margins.
- Floating vs. Fixed Dynamics: Decreasing short-term rates make variable-rate debt more attractive for shorter holding periods, prompting sponsors to evaluate comparing fixed vs variable commercial loan rates when structuring debt for value-add acquisitions.
10-Year Treasury Yield Predictions
The 10-Year U.S. Treasury Yield serves as the underlying risk-free benchmark for long-term fixed-rate commercial debt, including agency, bank, and CMBS loans. (10-Year U.S. Treasury Yield)
- Yield Range Expectations: Financial markets project the 10-Year Treasury yield to fluctuate between 3.60% and 4.10% throughout 2026. Global demand for U.S. sovereign debt and economic growth expectations continue to anchor long-term yields.
- Credit Spread Normalization: Lender spreads over Treasuries have narrowed from cycle highs. Institutional quality multifamily and industrial assets command spreads between 140 and 190 bps over the 10-Year Treasury, translating into effective fixed interest rates of 5.25% to 6.00%.
- Maturity Wall Integration: An estimated $875 billion billion in commercial real estate loans mature in 2026. Stabilized benchmark rates provide refinancing opportunities for borrowers seeking to replace maturing debt.
How Rate Volatility Impacts Pro-Forma Cash Flows
Interest rate fluctuations directly influence real estate deal performance, property valuations, and debt coverage compliance. Unhedged rate movements can compress investment returns and impact distribution schedules.
Key Operational Impacts of Rate Volatility
- Debt Service Coverage Ratio (DSCR) Compression: A 100-basis-point increase in borrowing costs elevates annual debt payments, reducing property DSCR. For example, on a $10,000,000 loan with 25-year amortization, a rate increase from 5.50% to 6.50% increases annual payments by approximately $67,000, directly reducing net cash flow.
- Cap Rate Sensitivity and Capital Value: Capitalization rates track long-term debt costs over time. Higher borrowing costs limit transaction leverage, placing upward pressure on cap rates and adjusting asset valuations.
- Refinancing Gap Risks: Assets financed at lower rate cycles may face capital shortfalls upon loan maturity if cash flow growth has not paced debt cost increases. Sponsors must prepare cash-in refinancing strategies or secure supplemental mezzanine capital to bridge value gaps.
Understanding the underlying factors determining commercial loan rates allows sponsors to stress-test pro-formas, structure appropriate interest rate caps, and negotiate favorable loan terms.
Frequently Asked Questions (FAQ)
What is the average commercial real estate interest rate in 2026?
The average commercial real estate rate in 2026 ranges between 5.85% and 7.35% for conventional bank, agency, and CMBS loans. Specialized programs like agency multifamily offer rates starting as low as 5.50%, whereas non-recourse bridge loans range from 8.75% to 11.50%.
Will commercial loan interest rates drop significantly in 2026?
While interest rates have adjusted downward from their peak levels, market projections do not anticipate a return to ultra-low historic rates (3%–4%). Instead, benchmark rates are expected to stabilize near long-term historical averages, with the 10-Year Treasury remaining between 3.60% and 4.10%.
How does SOFR affect my commercial mortgage rate?
SOFR (Secured Overnight Financing Rate) serves as the base benchmark for variable-rate commercial loans. If your loan terms are structured as SOFR + 2.50% with a floor of 4.00%, your interest rate adjusts as SOFR fluctuates. As SOFR declines, your monthly interest obligations drop accordingly until reaching the floor limit.
What is a debt yield, and why are lenders focusing on it more than LTV?
Debt yield is calculated as Net Operating Income divided by the total loan amount ($\text{Debt Yield} = \frac{\text{NOI}}{\text{Loan Amount}}$). Unlike Loan-to-Value (LTV), which relies on appraisal valuations, debt yield measures raw cash flow return relative to debt exposure. Lenders utilize debt yield (typically requiring 9.0% to 11.0%) to ensure sustainable debt sizing regardless of cap rate volatility.