
Navigating Commercial Property Loan Rates & Pricing Factors
In commercial real estate investment, interest rate pricing is one of the most significant determinants of net cash flow, debt service coverage capacity, and long-term project yield. A shift of even 50 basis points (0.50%) on a multi-million-dollar commercial mortgage can dramatically alter an investor’s return on equity (ROE) and exit valuation models in 2026.
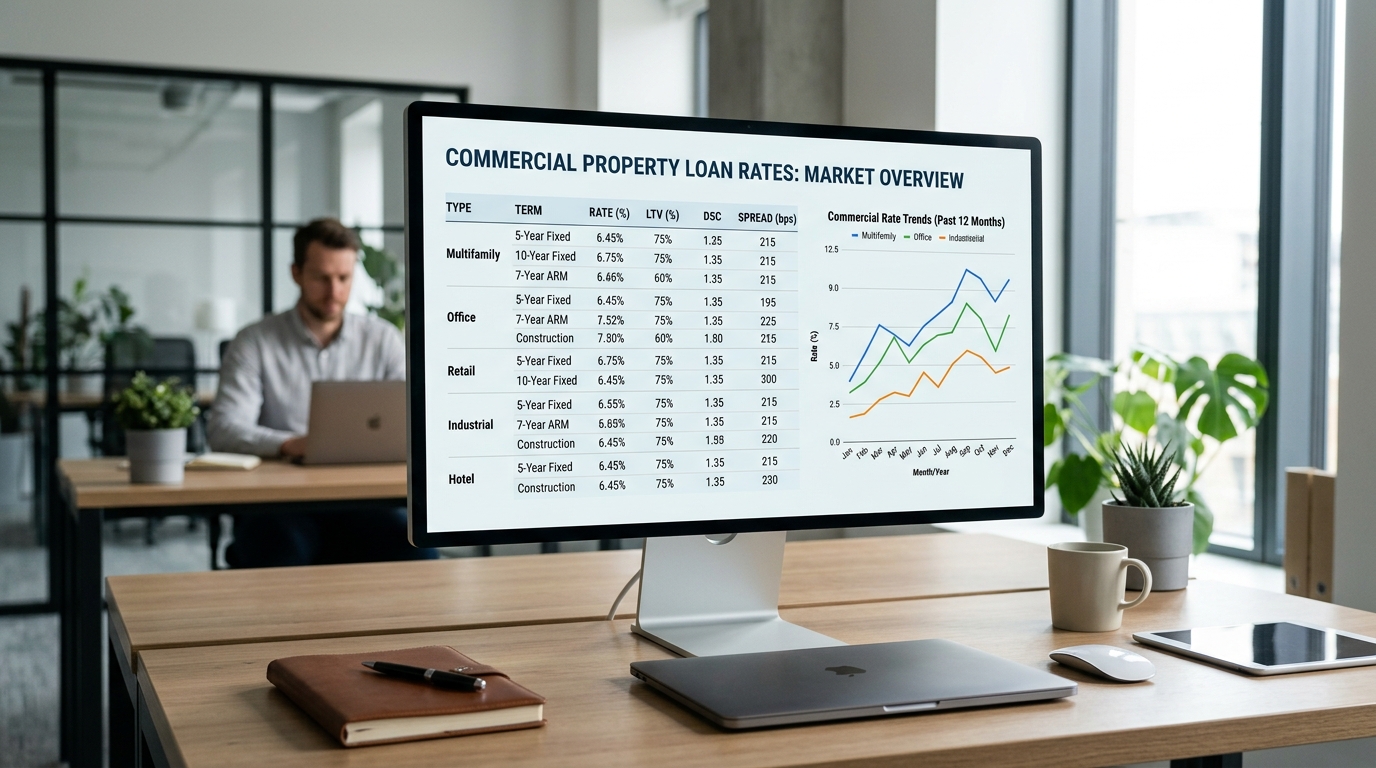
A snapshot of current commercial property loan rates, showcasing average interest rate ranges and typical rate structures across different lending categories.
Understanding how commercial property loan rates are established—and identifying the economic benchmarks and risk premiums that drive lender pricing—enables real estate investors and business owners to secure optimal debt terms. To evaluate alternative funding solutions alongside interest rate dynamics, explore rates for commercial property hard money loans.
Current Commercial Loan Rates Benchmarks
Commercial mortgage interest rates vary across lender categories, loan structures, property types, and leverage levels. Unlike residential mortgages that follow standardized government agency guidelines, commercial loan pricing is tailored individually for each transaction.
What interest rates can I expect on a commercial property loan?
The benchmark rate ranges across primary commercial lending categories reflect current credit market conditions:
| Commercial Loan Category | Average Interest Rate Range | Rate Structure Options | Standard Amortization |
|---|---|---|---|
| Conventional Bank Loans | 6.25% – 7.75% | 5-Yr / 10-Yr Fixed | 20 to 25 Years |
| SBA 504 Loans (CDC Debenture) | 5.75% – 6.85% | 10-Yr / 20-Yr / 25-Yr Fixed | 20 to 25 Years |
| SBA 7(a) Loans | 8.50% – 11.25% | Prime + Floating Spread | Up to 25 Years |
| CMBS (Conduit Loans) | 6.10% – 7.35% | 5-Yr / 10-Yr Fixed | 25 to 30 Years |
| Life Insurance Companies | 5.50% – 6.50% | Long-Term Fixed (10–25 Yrs) | 25 to 30 Years |
| Commercial Bridge Loans | 7.75% – 10.50% | SOFR + Variable Spread | Interest-Only (1–3 Yrs) |
| Commercial Hard Money Loans | 9.50% – 13.00%+ | Short-Term Fixed / Floating | Interest-Only (6–24 Mos) |
Key Drivers of Commercial Interest Rates
Commercial loan pricing is composed of two distinct components: a base benchmark index rate plus a lender risk premium spread.
$$\text{Final Commercial Interest Rate} = \text{Benchmark Index Rate} + \text{Lender Risk Premium Spread}$$
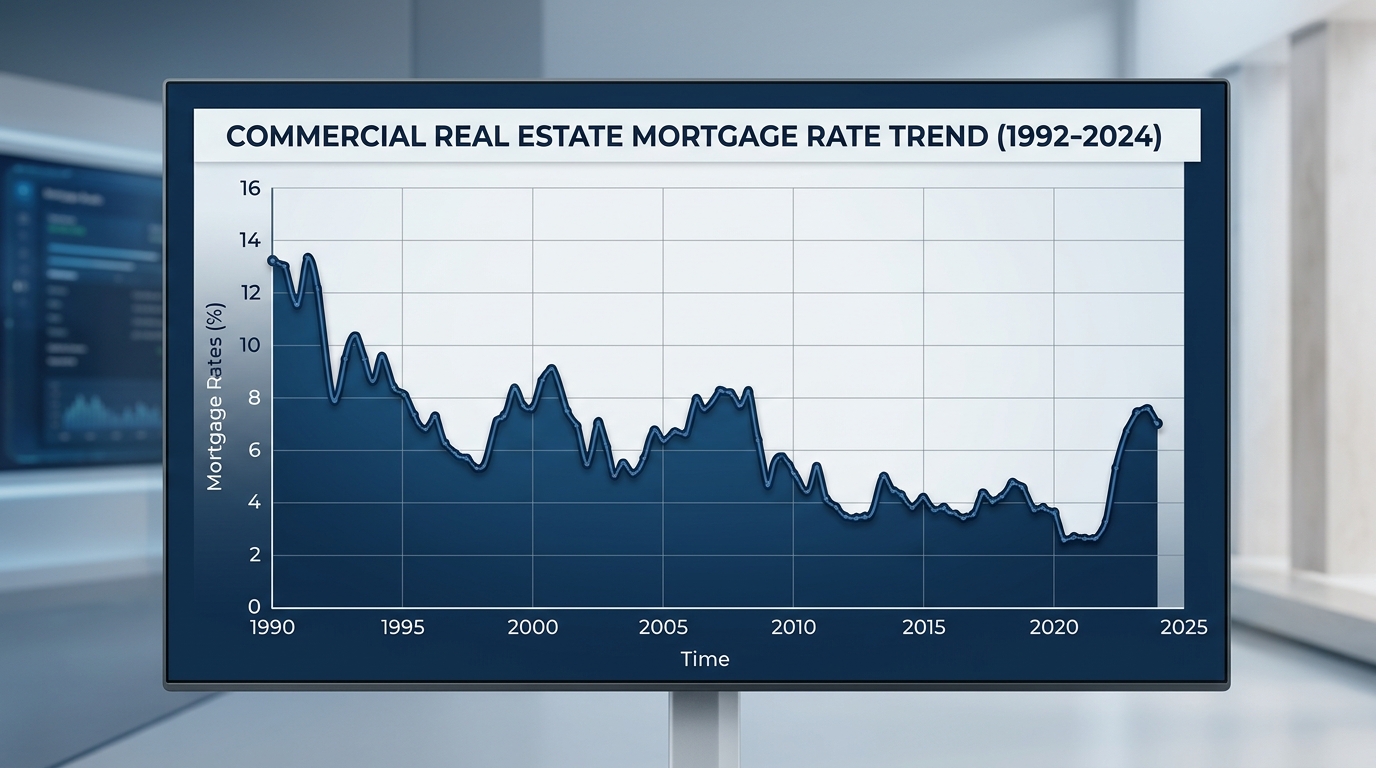
Historical trends of commercial real estate mortgage rates, illustrating how rates have evolved over time in response to economic factors.
Treasury Yields, SOFR, and Lender Risk Premiums
-
U.S. Treasury Yields (Fixed-Rate Benchmarks):
Fixed-rate commercial mortgages (such as conventional bank loans, CMBS conduit debt, and life insurance company loans) are priced relative to underlying U.S. Treasury yields, specifically the 5-Year, 7-Year, or 10-Year Treasury notes. Lenders add a credit spread—typically ranging between 175 and 300 basis points (1.75% to 3.00%)—above the corresponding Treasury yield to establish the borrower’s final fixed rate. -
SOFR – Secured Overnight Financing Rate (Floating-Rate Benchmarks):
Variable-rate loans, such as bridge debt and construction capital, rely on SOFR as their underlying benchmark index. Lenders price floating loans as SOFR plus a margin spread (e.g., SOFR + 350 bps). As the Federal Reserve adjusts benchmark monetary policy, SOFR moves accordingly, altering the borrower’s monthly debt payments. -
Lender Risk Premiums:
The spread added to the base index reflects specific transaction risks:
* Leverage Level: Higher LTV ratios (e.g., 75% vs. 60%) carry wider risk spreads.
* Sponsor Experience: Established real estate operators command narrower credit spreads than first-time buyers.
* Property Cash Flow Stability: Properties with higher DSCR coverage (e.g., 1.40x+) receive preferred rate discounts.
To select the appropriate product category for your acquisition strategy, evaluate diverse financing options based on commercial real estate loan types.
How Property Type and Occupancy Affect Your Interest Rate
Commercial lenders adjust interest rates based on the underlying stability and market liquidity of specific real estate asset classes:
+-------------------------------------------------------------------------+
|                PROPERTY SECTOR INTEREST RATE RISK PROFILE               |
|                                                                         |
|   Lowest Rates <-----------------------------------------> Highest Rates|
|   [Multifamily]  [Industrial]   [Anchored Retail]  [Office]  [Hospitality]|
|   (Low Vacancy) (High Demand)   (Credit Tenants)  (High CapEx) (Volatile)|
+-------------------------------------------------------------------------+
- Multifamily (5+ Units): Receives the lowest interest rate pricing across the commercial spectrum due to diversified tenant bases and agency backing (Fannie Mae / Freddie Mac).
- Industrial & Logistics Warehouses: Highly favored by lenders due to low capital expenditure needs and strong e-commerce tenant demand, driving narrow credit spreads.
- Anchored Retail Centers: Properties anchored by grocery chains or national credit-rated tenants command low rates. Unanchored strip centers with local tenants carry higher interest margins.
- Office Buildings: Suburban office assets face wider risk premiums (often 50–150 bps higher than industrial) due to evolving remote work trends, tenant rollover risks, and high lease-up costs.
- Hospitality & Special Purpose Properties: Hotels, motels, and entertainment venues carry the highest interest rate pricing because their operating income varies daily rather than relying on long-term lease contracts.
Commercial vs. Residential Pricing Differences
Borrowers transitioning from residential real estate investing often express surprise at the pricing, fee structures, and loan term differences between home loans and commercial debt.
Are interest rates higher on commercial property loans than residential mortgages?
Yes. Commercial property loan interest rates are typically 0.50% to 2.00% higher than standard 30-year residential mortgage rates.
This price premium reflects several structural differences:
- Collateral Complexity: Commercial real estate values depend on business operations, tenant lease stability, and regional economic factors, whereas residential real estate values rely on neighborhood home sales comps.
- Amortization and Balloon Terms: Commercial loans are rarely fixed for 30 full years. They feature 5-to-10-year maturity balloons with 20-to-25-year amortization periods, exposing borrowers to refinancing execution risk at maturity.
- Prepayment Penalties: Commercial debt features structured prepayment penalties (such as yield maintenance, defeasance, or step-down schedules) designed to guarantee lender yield returns, unlike residential loans where borrowers can refinance without penalty at any time.
Understanding how property operating cash flows affect lender risk evaluations is detailed in our review of how rates impact commercial property loan requirements.
Fixed-Rate Terms vs. Floating Rates
Choosing between fixed-rate pricing and floating-rate structures depends on your target holding period, risk appetite, and value-add business plan.
Fixed-Rate Mortgages
Fixed-rate financing provides predictable debt service costs, insulating property cash flows against broader market interest rate volatility.
* Best For: Stabilized properties held for 5 to 10+ years where preserving predictable cash flow yields is the primary goal.
* Trade-Off: Limited flexibility for early loan payoff due to strict defeasance or yield maintenance prepayment penalties.
Floating-Rate Loans
Floating-rate debt fluctuates in sync with base benchmark indices (SOFR).
* Best For: Value-add repositionings, bridge acquisitions, or short holding periods (1 to 3 years) where early repayment flexibility is required.
* Trade-Off: Uncapped interest rate spikes can increase monthly debt payments, eroding cash flow margins if benchmark rates rise unexpectedly.
Navigating Interest Rate Caps and Swaps
To manage interest rate volatility on floating-rate commercial loans, institutional borrowers and private investors utilize interest rate risk management tools:
- Interest Rate Caps: An insurance policy purchased upfront that places a maximum ceiling (cap) on how high the floating benchmark rate (SOFR) can rise during the loan term.
- Interest Rate Swaps: A contractual agreement that converts a variable floating-rate payment stream into a fixed-rate obligation, giving the borrower predictable debt service while allowing the lender to maintain floating debt on its balance sheet.
Frequently Asked Questions
What benchmark index is most commonly used for commercial loan rates?
The two most widely used benchmark indices for commercial real estate debt are the 10-Year U.S. Treasury Yield (for fixed-rate loans) and the Secured Overnight Financing Rate (SOFR) (for floating-rate loans).
What is a basis point in commercial real estate lending?
A basis point (bps) is a unit of measurement equal to 1/100th of 1 percent (0.01%). For example, 100 basis points equals 1.00%, and 25 basis points equals 0.25%.
Why are commercial mortgage prepayment penalties so strict?
Lenders—especially CMBS conduit lenders and life insurance companies—structure commercial debt to secure guaranteed yield returns over specific term windows. Prepayment penalties (yield maintenance and defeasance) ensure the lender receives the exact financial yield promised when the loan was originated.
How does Debt Yield differ from DSCR when setting loan rates?
While DSCR measures net income relative to actual debt payments, Debt Yield calculates Net Operating Income (NOI) as a direct percentage of total loan proceeds ($\text{Debt Yield} = \frac{\text{NOI}}{\text{Loan Amount}}$). Lenders often enforce a minimum 9% to 10% Debt Yield threshold to cap maximum loan sizing regardless of interest rate conditions.